5.13 Control Charts
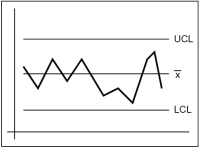
Control charts may be used as an alternative to parametricA statistical test that depends upon or assumes observations from a particular probability distribution or distributions (Unified Guidance). prediction limits for detection monitoring purposes and are commonly used to monitor the stability of groundwater data and to detect changes in data trends that may require further investigation. Control charts offer an advantage over prediction limitsIntervals constructed to contain the next few sample values or statistics within a known probability (Unified Guidance). because they generate a graph of compliance data over time and allow for better identification of long-term trends. To generate control chartsGraphical plots of compliance measurements over time; alternative to prediction limits (Unified Guidance)., a control limit is estimated from backgroundNatural or baseline groundwater quality at a site that can be characterized by upgradient, historical, or sometimes cross-gradient water quality (Unified Guidance). data and subsequently compared to a set of compliance point measurements. A calculated comparison value that exceeds the control limit suggests that compliance point concentrations exceed background. Control charts may be constructed as interwellComparisons between two monitoring wells separated spatially (Unified Guidance). or intrawellComparison of measurements over time at one monitoring well (Unified Guidance). comparisons; background data are collected from upgradient or other background wells for interwell comparisons, and from historical measurements at a targeted compliance well for intrawell comparisons. Baseline parameters (estimates of the meanThe arithmetic average of a sample set that estimates the middle of a statistical distribution (Unified Guidance). and standard deviation) are obtained from the background data. As future compliance observations are collected, the baseline parameters are used to standardize the newly gathered data. A new observation is considered “out of control” if it exceeds the baseline control limits, thus indicating a spike or significant change in the trend of the data.
Examples of control chart tests include the Shewart control limit and the cumulative sum control chart (CUSUM). The Shewart control limit tests for and flags a sudden spike or change in trend of the data, which may indicate an event such as a new release at the site. The CUSUM control limit tests for and flags a gradual, but significant, increase or decrease over time, which may, for example, indicate plume migration.
- Control charts may be used for a graphical representation of upper and lower prediction limits.
- Study Question 2: Are concentrations greater than background concentrations?
- Study Question 3: Are concentrations above or below a criterionGeneral term used in this document to identify a groundwater concentration that is relevant to a project; used instead of designations such as Groundwater Protection Standard, clean-up standard, or clean-up level.?
- Data must follow a normal distributionSymmetric distribution of data (bell-shaped curve), the most common distribution assumption in statistical analysis (Unified Guidance). or be reasonably symmetric, and also be independent.
- This method assumes a stationaryA distribution whose population characteristics do not change over time or space (Unified Guidance). mean for background data (meaning that no trends are present in the data set or subsets of the data).
- Comparison of compliance data against a control limit assumes that the two populations being compared have similar variances. This condition can be assessed using a homogeneity of varianceThe square of the standard deviation (EPA 1989); a measure of how far numbers are separated in a data set. A small variance indicates that numbers in the dataset are clustered close to the mean. test, but will be difficult to test directly unless you have at least four independent observations from each population (background and compliance).
- Check the data for normality.
- Check the data for a stationary background mean using a test such as the Mann-Kendall trend test.
- Use of a minimum of 8 to 10 measurements to establish background is recommended.
- If you suspect outliers, examine the data using a probability plot, Dixon's test, or Rosner's test, or another appropriate method. Remove outliersValues unusually discrepant from the rest of a series of observations (Unified Guidance). from the data set, if appropriate.
- Consider conducting a test for autocorrelationCorrelation of values of a single variable data set over successive time intervals (Unified Guidance). The degree of statistical correlation either (1) between observations when considered as a series collected over time from a fixed sampling point (temporal autocorrelation) or (2) within a collection of sampling points when considered as a function of distance between distinct locations (spatial autocorrelation). of the background data to ensure that the sampling interval affords uncorrelated measurements.
- Nondetects generally should not exceed 25% of all samples (otherwise, the variance is not adequately defined).
- The Shewhart-CUSUMcumulative sum control chartcontrol chart initially featured two control limits (h=5 and single control limit (SCL) =4.5, see Gibbons 1994). However, later research (Davis 1999) indicated a single control limit h=SCL=4.5 is sufficient and slightly more conservative. You should update the baseline statistics, including the preliminary data set mean and variance, every two years (Gibbons 1994).
- Control charts can be constructed as either interwell or intrawell tests.
- Compared to trend tests, control charts provide a visual representation of compliance data over time and allow for better identification of gradual, long term trends.
Control charts are discussed in Chapter 20, Unified Guidance. The basic procedure for constructing a Shewhart-CUSUMcumulative sum control chartcontrol chart is presented in Chapter 20.2, Unified Guidance. Example 20-1 presents a data set, and Figure 20-2 displays the chart itself with the control limit plotted as a horizontal line. Gibbons (1994) features combined Shewhart-CUSUM control charts in Chapter 8.4, “Intrawell Comparisons”.
Publication Date: December 2013